Robust Economic Foundations
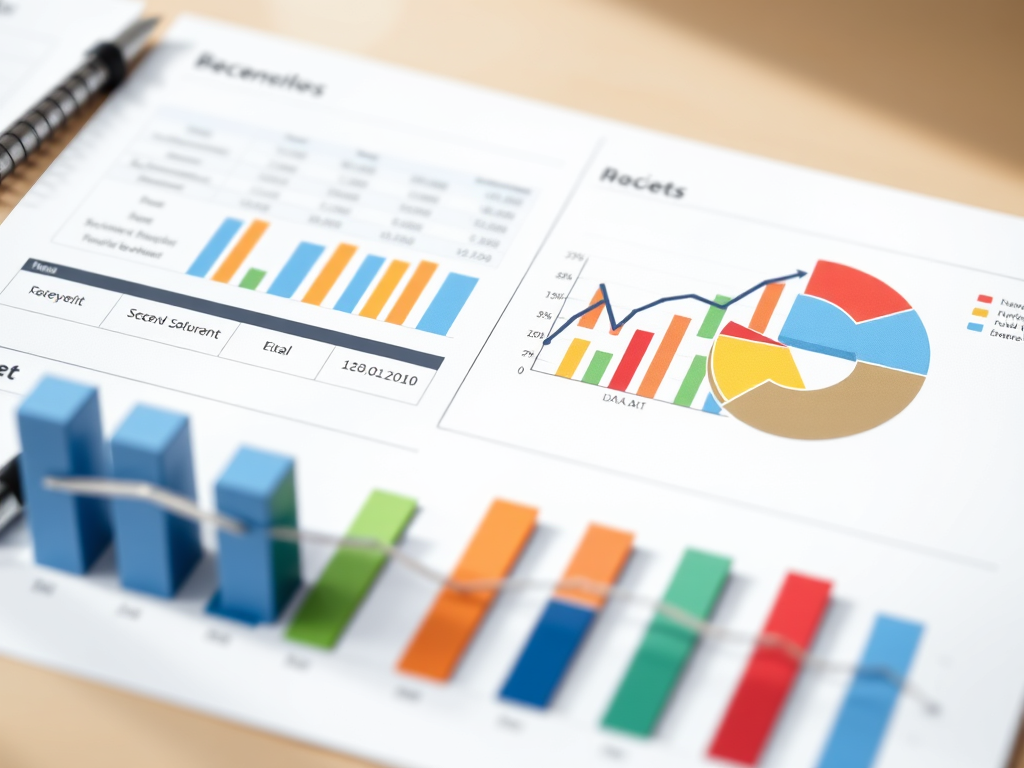
The receipts and expenditure charts show both the composition and direction of the budget aggregates, using ₹ lakh crore as the unit for receipts/expenditures. Capital receipts rise notably in BE 2026–27, and effective capital expenditure also steps up, indicating a continuing emphasis on investment even as revenue expenditure remains the larger base.
The “robust economic foundations” visuals add two lenses: net receipts of the centre (net tax revenue, non-tax revenue, and non-debt capital receipts) and the overall transfers to states and union territories. The “major items” panel lists sector-wise outlays in ₹ crore for key spending heads.
Explainer Table 1 — Receipts and expenditures (₹ lakh crore)
| Metric | 2024–25 (Actuals) | 2025–26 (BE) | 2025–26 (RE) | 2026–27 (BE) |
| Capital receipts | 16.2 | 16.4 | 16.2 | 18.1 |
| Revenue receipts | 30.4 | 34.2 | 33.4 | 35.3 |
| Effective capital expenditure | 13.2 | 15.5 | 14.0 | 17.1 |
| Revenue expenditure | 36.0 | 39.4 | 38.7 | 41.3 |
Explainer Table 2 — Foundations snapshot: net receipts, transfers, and major-item spends
| Indicator | 2022–23 | 2023–24 | 2024–25 | 2025–26 (RE) | 2026–27 (BE) |
| Centre’s net tax revenue (₹ lakh crore) | ~20.2 | ~22.4 | ~24.1 | ~25.8 | 28.7 |
| Non-tax revenues (₹ lakh crore) | ~2.8 | ~3.9 | ~5.4 | ~6.6 | 6.7 |
| Non-debt capital receipts (₹ lakh crore, RHS line) | ~0.74 | ~0.65 | ~0.47 | ~0.66 | 1.2 |
| Total transfer to States & UTs (₹ lakh crore) | 18.7 | 20.7 | 22.3 | 23.4 | 26.2 |
Major expenditure items (₹ crore) (selected highlights from the “major items” panel):
| Head (₹ crore) | Amount | Head (₹ crore) | Amount |
| Transport | 5,98,520 | Rural Development | 2,73,108 |
| Defence | 5,94,585 | Home Affairs | 2,55,234 |
| Agriculture & allied activities | 1,62,671 | Education | 1,39,289 |
| Energy | 1,09,029 | Health | 1,04,599 |
| Urban Development | 85,522 | IT & Telecom | 74,560 |
| Commerce & Industry | 70,296 | Social Welfare | 62,362 |
| Scientific Departments | 55,756 | Tax Administration | 45,500 |
| External Affairs | 22,119 | Finance | 20,649 |
| Development of North East | 6,812 |